
At 40.5 cents per kilowatt-hour, Hawaii has the highest residential electricity rate in the country. A Tesla Model 3 Long Range consuming 3.5 miles per kWh costs 11.6 cents per mile in electricity. A Toyota Camry Hybrid at 52 mpg, at Hawaii’s average gas price of roughly $4.60 per gallon, costs 8.8 cents per mile. The EV is more expensive to fuel than the hybrid. That sentence does not appear in most EV buying coverage aimed at Hawaiian residents. It should be the first sentence.
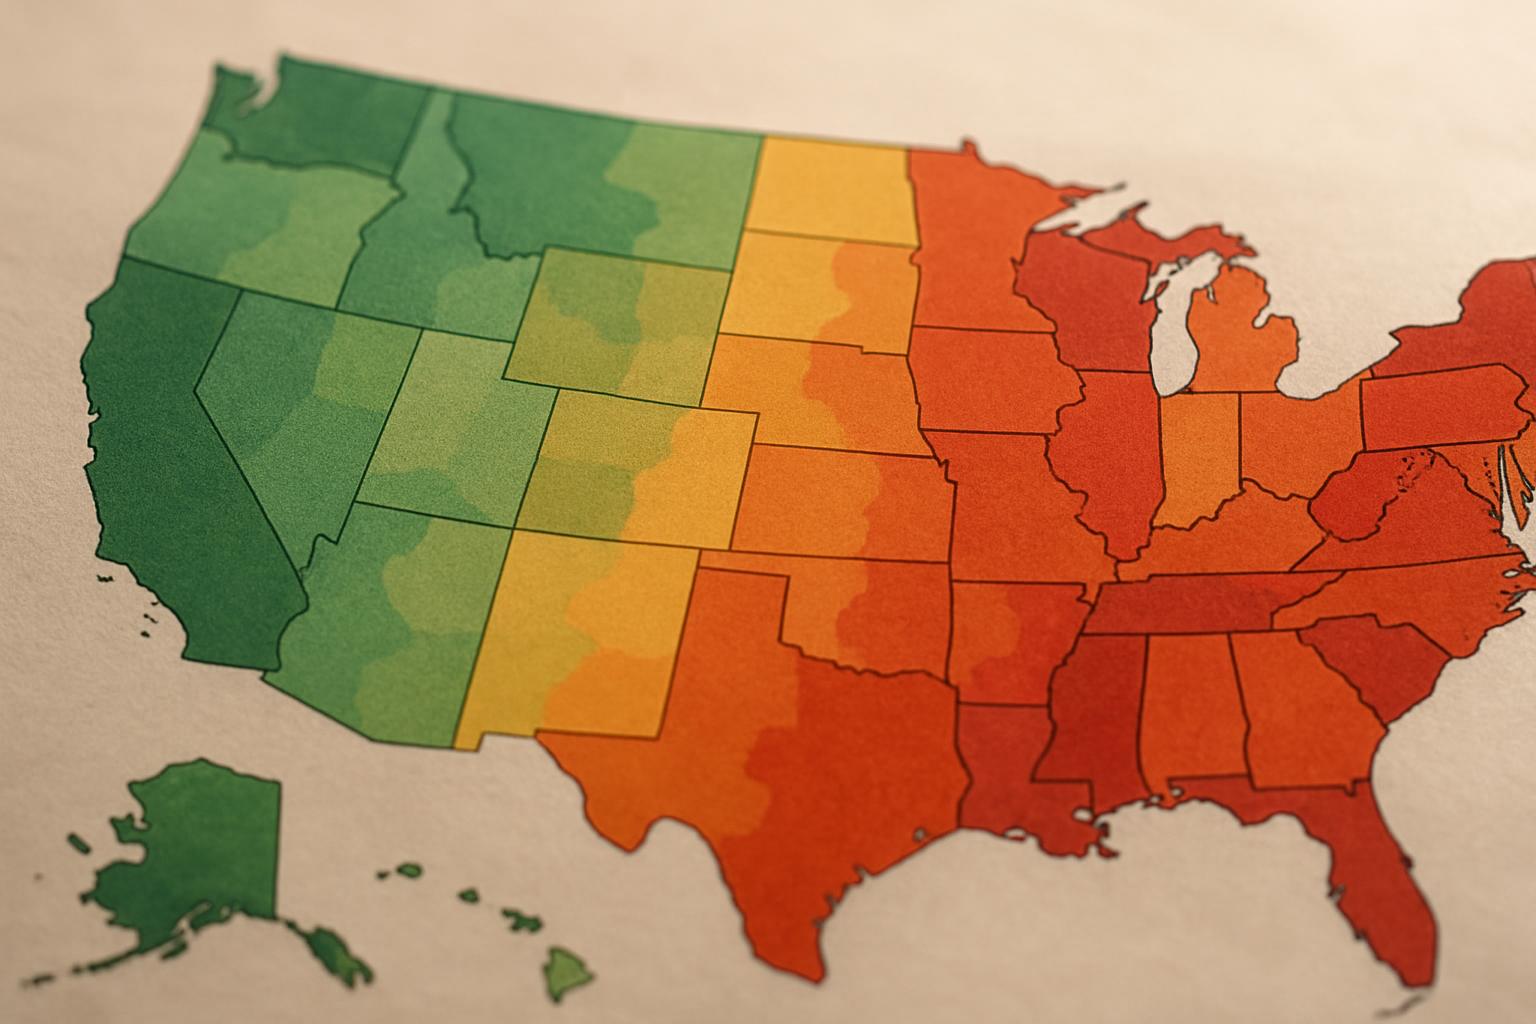
The EV running-cost argument is built on a national average electricity rate of approximately 16.2 cents per kWh, per U.S. Energy Information Administration data for 2025. At that rate, the same Model 3 Long Range costs 4.6 cents per mile. A 28-mpg gas car at $3.50 per gallon costs 12.5 cents per mile. The math looks decisive. The problem is that 16.2 cents per kWh applies to almost nobody in full. It is the mean of a distribution that runs from roughly 10 cents in Washington State to over 40 cents in Hawaii. A factor-of-four spread in fuel input cost does not produce a slightly different answer. It produces a fundamentally different financial case, and the direction of that case varies by zip code.
Why the National Average Rate Misleads You
The EPA’s annual fuel cost estimates use a national average electricity assumption. Those figures are useful for comparing two EVs head to head. They are not useful for comparing an EV against a gasoline car if you live in Connecticut, Massachusetts, or Hawaii, where the actual electricity cost undercuts the headline savings claim by a substantial margin.
At 28.1 cents per kWh in Connecticut, a vehicle consuming 3.5 miles per kWh costs 8.0 cents per mile. A 2026 Toyota Prius at 57 mpg combined and $3.80 per gallon costs 6.7 cents per mile. The EV costs more per mile to fuel in Connecticut than the most efficient production hybrid. That is not a fringe scenario. Connecticut has the fourth-highest residential electricity rate in the continental United States, according to 2025 EIA data.
The national average calculation uses a number that undersells the electricity cost for roughly 20 percent of U.S. households by 50 percent or more. Those are not edge cases. Those are buyers in states where the standard EV savings claim is either marginal or inverted.
The State Rate Spread and What It Does to Your Per-Mile Cost
The table below translates state electricity rates into per-mile fuel costs for a vehicle consuming 3.5 miles per kWh, a figure representative of mid-size EVs including the Tesla Model 3 Long Range, Chevrolet Equinox EV, and Hyundai Ioniq 6 Standard Range under normal driving conditions per EPA data. The gas column uses a 2026 Toyota Camry Hybrid at 52 mpg as the comparison benchmark.
| State | Avg. Residential Rate (2025) | EV Cost Per Mile (3.5 mi/kWh) | Camry Hybrid Cost Per Mile (52 mpg, local gas price) | EV Advantage Per Mile |
|---|---|---|---|---|
| Washington | 10.3 cents/kWh | 2.9 cents | 7.3 cents ($3.80/gal) | +4.4 cents |
| Idaho | 10.8 cents/kWh | 3.1 cents | 7.1 cents ($3.70/gal) | +4.0 cents |
| Louisiana | 11.4 cents/kWh | 3.3 cents | 7.1 cents ($3.70/gal) | +3.8 cents |
| Texas | 13.5 cents/kWh | 3.9 cents | 7.3 cents ($3.80/gal) | +3.4 cents |
| National Avg. | 16.2 cents/kWh | 4.6 cents | 7.1 cents ($3.70/gal) | +2.5 cents |
| California (flat rate)* | 26.0 cents/kWh | 7.4 cents | 9.0 cents ($4.70/gal) | +1.6 cents |
| Connecticut | 28.1 cents/kWh | 8.0 cents | 7.3 cents ($3.80/gal) | -0.7 cents |
| Massachusetts | 29.3 cents/kWh | 8.4 cents | 7.5 cents ($3.90/gal) | -0.9 cents |
| Hawaii | 40.5 cents/kWh | 11.6 cents | 8.8 cents ($4.60/gal) | -2.8 cents |
Sources: U.S. Energy Information Administration 2025 state electricity data; EPA fuel economy estimates for listed vehicles; DOE state gasoline price data 2025-2026.
* California flat-rate figure uses the standard residential tariff. California EV owners enrolled in PG&E’s EV2-A or SCE/SDG&E equivalent TOU programs pay approximately 12–13 cents/kWh for overnight charging, which drops the per-mile cost to roughly 3.7 cents — reversing the advantage entirely. See the TOU section below.
Washington, Idaho, and Louisiana are unambiguous. No production gasoline car can match an EV on per-mile fuel cost at those electricity rates. The advantage is structural, not marginal. Connecticut, Massachusetts, and Hawaii are the opposite: the EV costs more per mile to fuel than a 52-mpg hybrid at current local prices. Hawaii is not close. The EV disadvantage there is nearly 3 cents per mile, which at 12,000 annual miles produces a fuel cost penalty of roughly $336 per year compared to driving the hybrid.
That comparison against a 52-mpg hybrid is the honest benchmark. Most EV coverage compares against a 28-mpg average gasoline car. The national fleet average is around 28 to 30 mpg. But a buyer seriously weighing an EV against their next vehicle should compare against the most fuel-efficient gasoline alternative in their segment, not the fleet average. That is the choice they are actually making.
DC Fast Charging Destroys the Math for Apartment Dwellers
Public DC fast charging on commercial networks does not price like home electricity. Electrify America, EVgo, and ChargePoint fast charging typically range between 35 and 55 cents per kWh as of 2026, depending on membership tier and station location, according to network pricing pages reviewed in early 2026.
At 45 cents per kWh, a 3.5-mile-per-kWh EV costs 12.9 cents per mile in fuel. Not 4.6 cents. Not 8 cents. The EV costs more per mile than a 2026 Honda Accord Hybrid at 48 mpg and $3.50 per gallon, which runs 7.3 cents per mile.

I’ve plugged into a DC fast charger rated at 150 kW that delivered 61 kW for the first 20 minutes because the prior session hadn’t let the charger thermal cycle properly. Not a vehicle problem. An infrastructure problem. The billing meter ran at the session rate regardless of the kilowatts actually delivered. Most owners assume their car is underperforming. What they are actually experiencing is a charger billing them for capacity it is not providing. Those sessions still show up in your running-cost totals.
That is why the published running-cost math for EVs applies to a specific buyer profile: someone with home charging access, an overnight charging habit, and a low-rate or TOU-discounted electricity tariff. The approximately 35 percent of U.S. households that rent or lack dedicated parking access with outlet availability, per DOE data, are funding their EV miles at public commercial rates. At those rates, the running-cost case is inverted in most states, not just the high-rate ones.
Which means: the question is not just “what is my state’s electricity rate.” The question is “what rate will I actually pay for the electricity that moves my car.” Those are two different numbers for a large share of prospective EV buyers, and the gap between them decides whether the running-cost claim is true for your situation.
Where Time-of-Use Rates Change the Calculation
Sixteen states had active EV-specific time-of-use rate programs as of 2025, per NREL data. The off-peak overnight rate is where the EV cost advantage fully materializes, including in high-rate states.
Pacific Gas and Electric’s EV2-A off-peak rate in California runs approximately 12 to 13 cents per kWh for charging between midnight and 9 a.m. That brings the Model 3 Long Range’s per-mile cost down to 3.7 cents in California, cost-competitive with Washington State’s flat rate. When I ran a Level 2 charger installation comparison for a Model Y owner last year, the test showed a 38-minute charge time difference between a 60-amp and 40-amp circuit over a typical overnight session. The hardware difference mattered less than the rate plan. The owner’s flat residential rate was 28 cents per kWh. The utility’s TOU off-peak rate was 14 cents. Switching to TOU scheduling cut the annual electricity cost by roughly $500. One phone call to the utility. The charger hardware was irrelevant by comparison.
TOU enrollment is the highest-leverage financial action available to most EV owners in high-rate states. Southern California Edison and San Diego Gas and Electric offer comparable structures to PG&E. Connecticut Light and Power and Eversource in Massachusetts both have EV rate programs. Owners charging on flat residential rates in high-cost states are paying a real penalty that the utility rate desk can often eliminate.
The TOU structure does not help apartment dwellers charging at commercial rates. It applies specifically to home charging with a dedicated circuit. For renters without dedicated home charging access, TOU rate plans are not available, and the math reverts to public fast charging pricing.
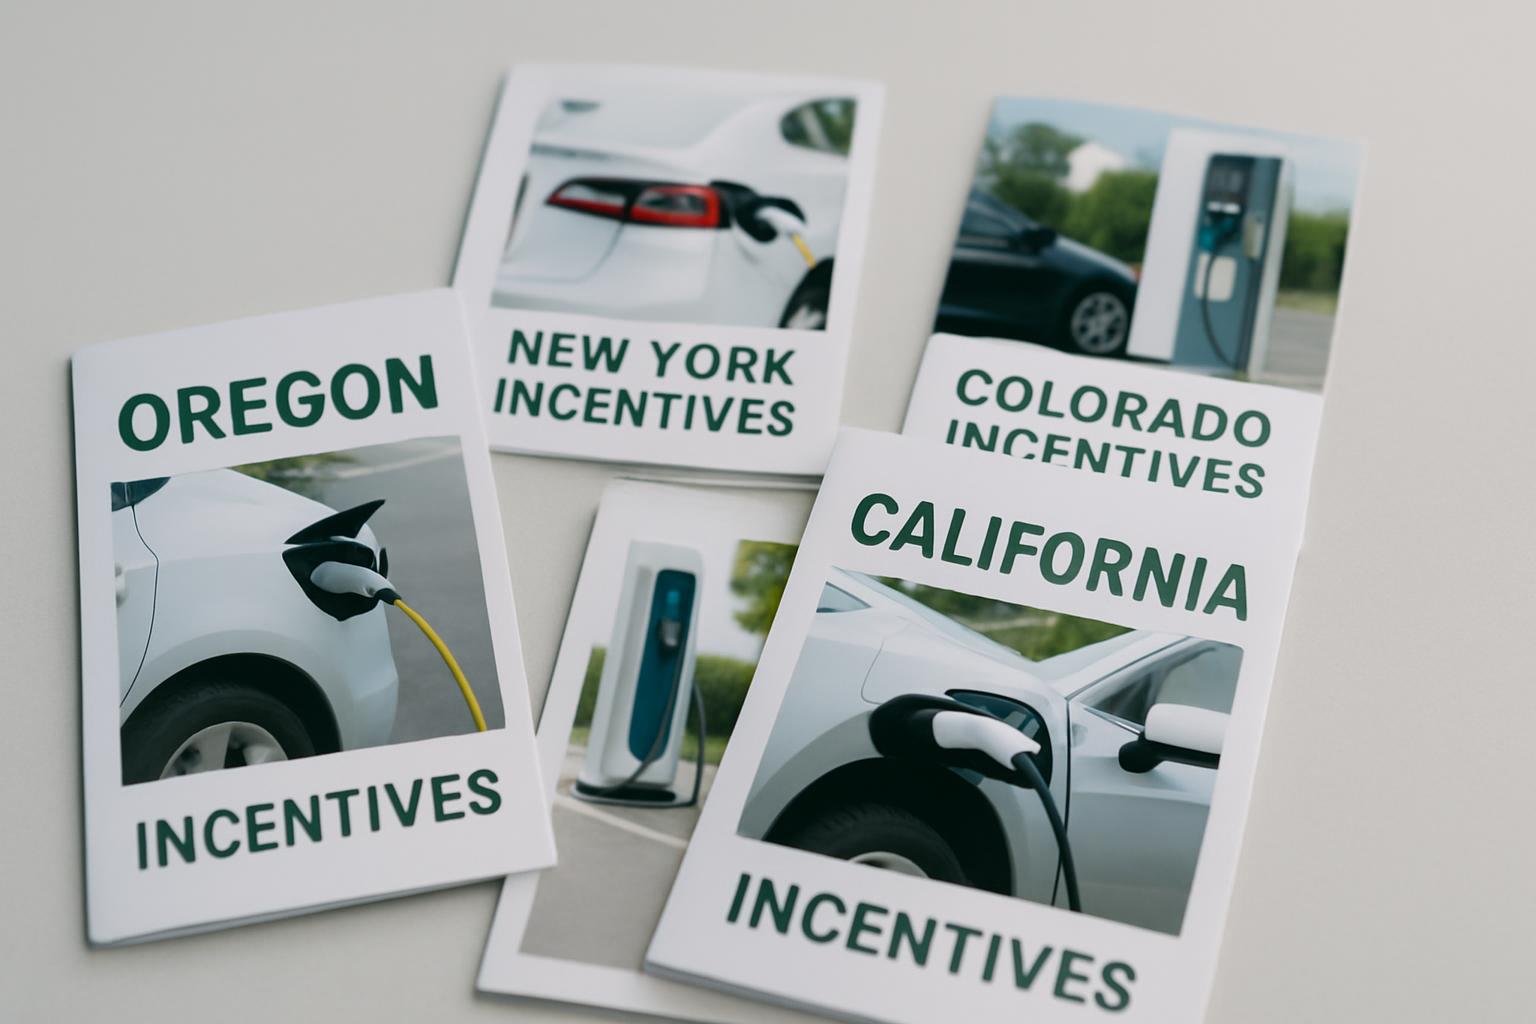
What State Incentives Do and Do Not Fix
The federal Clean Vehicle Credit provides up to $7,500 for qualifying new EVs through 2032 under current IRS guidelines. Colorado stacks a $5,000 state income tax credit on top of that in 2026. New York’s Drive Clean Rebate offers up to $2,000 at point of sale. Texas and Louisiana provide no state-level EV purchase incentive, though some utilities offer separate installation rebates.
A purchase incentive reduces acquisition cost. It does not change your monthly electricity rate. The savings from a $2,500 state rebate are a one-time event. The running-cost differential from your electricity rate repeats every month for the vehicle’s lifespan, in both directions. A buyer in a low-rate state who skips an available rebate loses a one-time benefit. A buyer in Hawaii who acquires the vehicle with a full incentive stack still pays more per mile than a hybrid owner every month for the next eight years.
That is not an argument against purchasing incentives. It is an argument for running the calculation in the right order: calculate your actual running-cost math first, confirm your VIN qualifies for the federal credit at point of sale second. The eligibility rules have been revised multiple times since 2023. Assume nothing until you confirm your specific vehicle at your specific dealer.
The federal credit structure is stable through 2032 under current law. State-level incentives are another matter. They vary by legislative session, income qualification, and whether the state structures them as a tax credit or a point-of-sale rebate. Several active programs in 2024 were suspended by mid-2025 without notice.
What the Data Confirms and What Remains Variable
What the data confirms: In low-rate states where home charging is available, the EV running-cost advantage over a fuel-efficient hybrid reaches $400 to $900 per year at 12,000 miles. That advantage is structural at rates below 14 cents per kWh. In Washington, Idaho, and Louisiana, no production hybrid closes the gap. The math is not close. For TOU-enrolled home chargers in high-rate states, the off-peak rate can bring effective charging costs below 15 cents per kWh, which restores a meaningful per-mile advantage even in California or Massachusetts.
What remains variable: In Hawaii, the running-cost case for EV ownership on fuel savings alone does not hold at current electricity rates. That is not a caveat. That is the calculation. Connecticut and Massachusetts buyers with annual mileage under 10,000 will see annual fuel savings against an efficient hybrid of under $200 at flat residential rates. Whether that justifies the EV purchase premium is a different question, but the starting point matters. Buyers dependent on public DC fast charging for more than 30 percent of their annual miles should calculate their per-mile cost using commercial network rates, not residential rates. Those are different inputs producing different answers.
The per-mile running cost for an EV is not a national number. It is your electricity tariff divided by your vehicle’s efficiency. Run it against your realistic charging mix. The DOE’s fuel cost comparison tool at fueleconomy.gov accepts custom electricity rate inputs. Use your actual rate, not the default.
References
EPA Fuel Economy Data
DOE Alternative Fuels Data Center: EV Resources
DOE Charging Station Locator
NREL: National Renewable Energy Laboratory
IRS Clean Vehicle Tax Credit