
The difference in annual charging cost for the same EV in Washington state versus Hawaii is roughly $900 to $1,400 per year, based on 2025 EIA residential rate data and typical EV consumption figures. That is a real budget line item, not a rounding error. And it is entirely separate from whether your state offers additional purchase incentives on top of the federal credit.
Comparing EV running costs across states is not complicated, but it requires knowing which numbers to look at and how to combine them. The electricity rate picture is the starting point. State incentives and public charging pricing layer on top of it. All three interact to produce a number that is specific to where you live and how you charge.
How Electricity Rates Drive the Core Cost Calculation
The cost to charge an EV comes down to one straightforward calculation: battery capacity in kilowatt-hours multiplied by your local electricity rate in cents per kWh. That is your cost per full charge. From there, divide by the car’s rated range to get cost per mile.
A Chevrolet Equinox EV with a 85 kWh usable battery in a state charging 10 cents/kWh costs about $8.50 to charge from near-empty to full. In California, where the residential rate averages closer to 27 cents/kWh, the same charge costs roughly $23. That spread compounds meaningfully over a year of driving.
According to the U.S. Energy Information Administration’s most recent residential rate data for 2025, the national average residential electricity rate was approximately 16.4 cents per kWh. But that average masks a wide range.
The cheapest states for home EV charging currently include Washington (around 10 cents/kWh), Louisiana (around 11 cents/kWh), and Idaho (around 10 cents/kWh). On the expensive end, Hawaii averages above 38 cents/kWh, California sits around 27 cents/kWh, and Massachusetts runs close to 23 cents/kWh.
State-by-State Rate Tiers: Where Your Location Puts You
The table below breaks down approximate residential electricity rates and the resulting annual home charging cost for a mid-range EV (assuming 15,000 miles driven per year and an efficiency of 3.5 miles per kWh, roughly in line with EPA data for the Ioniq 6 and Tesla Model 3 Standard Range).
| State | Approx. Rate (cents/kWh) | Annual Home Charging Cost (15k mi) | Rate Tier |
|---|---|---|---|
| Washington | ~10 | ~$429 | Low |
| Idaho | ~10 | ~$429 | Low |
| Louisiana | ~11 | ~$471 | Low |
| Texas | ~13 | ~$557 | Medium |
| Florida | ~14 | ~$600 | Medium |
| Ohio | ~14 | ~$600 | Medium |
| New York | ~20 | ~$857 | High |
| Massachusetts | ~23 | ~$986 | High |
| California | ~27 | ~$1,157 | High |
| Hawaii | ~38+ | ~$1,629+ | Very High |
Annual cost estimates use the formula: (15,000 miles / 3.5 miles per kWh) x rate. Rates are approximate based on EPA fuel economy data and EIA 2025 residential averages.
The spread here is not academic. A Washington state owner driving the same EV as a California owner saves roughly $728 annually on home charging alone. Over a five-year ownership period, that is more than $3,600 in straightforward cost difference, before any incentives or tax credits are factored in.
To be fair, high-rate states often have stronger state-level incentives that partially offset the charging cost gap. California’s Clean Vehicle Rebate Project, for instance, has historically offered additional rebates beyond the federal credit, though program funding and eligibility terms change year to year.
State Incentives in 2026: What Layers on Top of the Federal Credit
The federal new clean vehicle tax credit of up to $7,500 under the Inflation Reduction Act remains available through at least 2032 under current law, subject to income caps and vehicle MSRP limits. The IRS clean vehicle credit page maintains current eligibility details as the rules evolve.
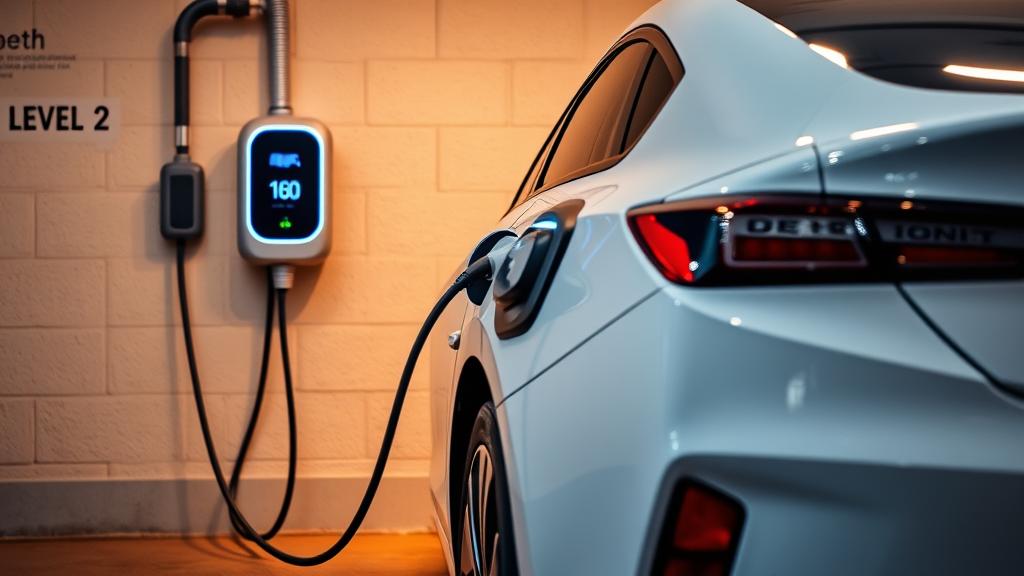
State programs are a different matter. They vary considerably by legislative session, available funding, and eligibility structure. Some are tax credits applied at filing. Others are rebates delivered at point of sale. A few are utility-administered programs that reduce the installation cost of a Level 2 home charger rather than the vehicle purchase price itself.
The DOE’s Alternative Fuels Data Center maintains a continuously updated database of state and utility incentives. In 2026, states with active, confirmed purchase incentive programs beyond the federal credit include Colorado (up to $5,000 state tax credit), New York (up to $2,000 via Drive Clean Rebate), and New Jersey (sales tax exemption on qualifying EVs worth roughly $1,800 to $2,500 depending on purchase price).
In our assessment, the state incentive stack is the most volatile variable in the whole cost picture. A program that exists when you are budgeting may not exist when you are ready to purchase. The data from the AFDC site reflects current program status, but cross-checking directly with your state DMV or energy office before committing to a purchase timeline is worth the extra step.
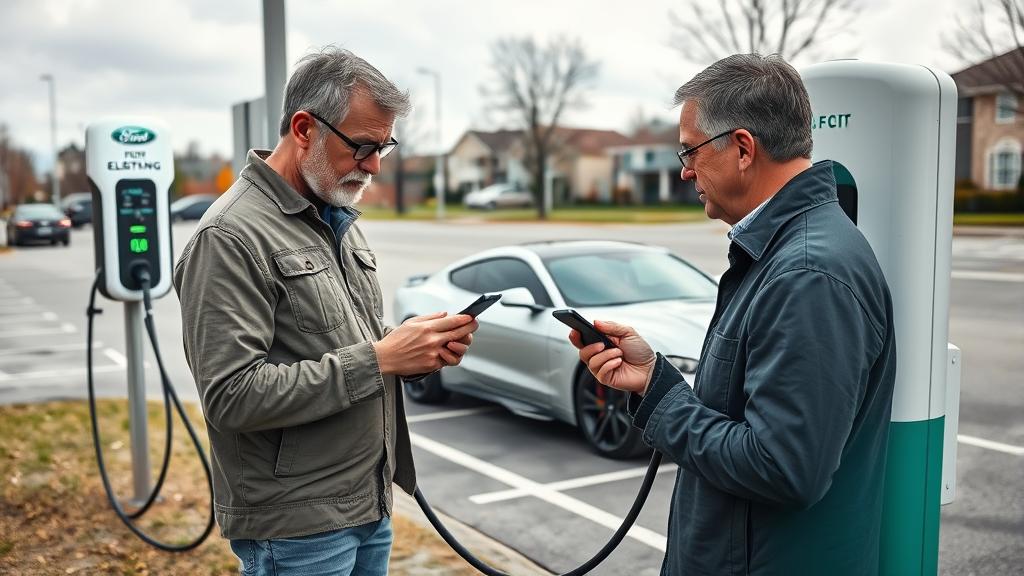
Home Charging vs. Public Charging: Two Different Cost Structures
Home charging and public charging have fundamentally different pricing models, and which one dominates your actual bill depends heavily on your living situation.
Think of home Level 2 charging as a subscription rate and public DC fast charging as pay-per-event pricing. The Level 2 charger at home runs at your residential electricity rate. DC fast charging at a commercial network runs at the network’s pricing, which is set independently and is often considerably higher.
As of 2026, major public charging networks including Electrify America and EVgo typically price DC fast charging between 43 and 53 cents per kWh in most markets, according to publicly listed rates on their respective network apps. That is three to five times the residential rate in low-cost states. In California or New York, the gap narrows considerably, but charging costs for public sessions are still typically 30 to 60 percent higher than home charging even in high-rate states.
The practical consequence is significant. An EV owner doing 80 percent of charging at home in Washington state will spend roughly $500 per year on charging. The same driver relying primarily on public DC fast charging could spend $1,800 or more annually. That gap matters when you are comparing an EV’s running costs against a gasoline alternative.
Apartment dwellers and renters without dedicated charging access face the most challenging math here. Public charging effectively becomes the primary option, and the cost advantage of EV ownership over gasoline narrows substantially in markets with expensive fast-charging infrastructure. Based on the data, an EV owner charging exclusively via DC fast charging in a high-rate state has a cost case that is marginal at best compared to a modern gasoline hybrid. This is a real limitation worth naming.
How to Run Your Own State-Specific Cost Calculation
The numbers in this article are illustrative, but running your own state-specific calculation takes about five minutes. You need three inputs:
- Your state’s current residential electricity rate (find it on your utility bill or via the EIA’s data browser)
- Your specific EV’s EPA-rated combined efficiency in miles per kWh (available on the EPA’s vehicle search at fueleconomy.gov)
- Your annual mileage estimate
Divide annual miles by miles per kWh to get total kWh needed per year. Multiply by your rate. That is your annual home charging cost.
For public charging costs, use the same kWh consumption figure and multiply by whatever the dominant network rate is in your area. Most networks list their per-kWh rates in their apps or on their websites.
One important variable: time-of-use pricing. Several utilities, particularly in California, Colorado, and New York, offer significantly lower overnight rates for EV owners. Pacific Gas and Electric’s EV2-A rate, for example, drops below 12 cents/kWh during off-peak overnight hours, which partially offsets California’s otherwise high daytime rates for EV owners willing to schedule overnight charging.
Conclusion
What the data confirms: Electricity rates create a real, calculable cost difference across states, and the gap is large enough to matter in any honest EV cost comparison. Washington, Idaho, and Louisiana represent genuinely low-cost environments for home EV charging, where annual costs for typical driving can stay under $500. California and Hawaii sit at the other end, though state incentives and time-of-use rate programs partially reduce the disadvantage for buyers who charge primarily at home on off-peak schedules.
What remains variable: State incentive programs are the least stable element of the cost picture. Program funding levels, eligibility terms, and even program existence can change with each legislative session. The federal credit structure is more predictable through 2032 under current law, but the state layer requires active verification at time of purchase. Public charging pricing is set by private networks and can change without notice, which makes any cost comparison that relies heavily on public charging inherently approximate.
For the most current state incentive data, the DOE’s Alternative Fuels Data Center is the most reliable single source. Pair that with your own utility rate and the EPA vehicle search tool for real-world efficiency figures, and you have enough to build an honest cost picture before signing anything.
References
- DOE Alternative Fuels Data Center: Electric Vehicles and State Incentives
- EPA Fuel Economy and EV Efficiency Data
- EPA Vehicle Search Tool
- IRS Clean Vehicle Tax Credit
- NREL: EV Energy Consumption and Cost Research
- DOE Charging Station Locator
- U.S. Energy Information Administration: Electricity Data
Disclaimer: The information provided in this article is for educational and informational purposes only. It does not constitute professional advice. Readers should conduct their own research and consult with qualified professionals before making any decisions.