
A new vehicle loses approximately 20% of its value the moment you drive it off the lot. For a $45,000 SUV, that is a $9,000 “exit fee” just for crossing the curb. Most buyers obsess over the interest rate on their 72-month loan, yet they completely ignore the fact that their asset is evaporating faster than they can pay down the principal.
By the end of this briefing, you will understand the specific mechanics of the “depreciation curve,” which brands actually hold their value according to Kelley Blue Book data, and why the “best” car for your lifestyle might be a financial disaster for your net worth. We’ll explore how the depreciation curve changes your buying calculus—whether you’re choosing between new and used, different vehicle segments, or even deciding if ownership (versus leasing) makes financial sense. We are going to look at real-world retention percentages from 2025 and 2026 data to show you how to stop subsidizing the next owner’s bargain.
The First Minute Costs More Than the First Year of Maintenance
The math of the “drive-off” drop is brutal. According to data from Edmunds True Cost to Own, the average new vehicle retains only about 60% of its original MSRP after five years of ownership. This isn’t a steady decline; it is a front-loaded cliff.
Why does the value plummet so fast? It is a shift in market classification. The second those tires hit public pavement, the car transforms from “New” to “Used.” In the eyes of a bank or a wholesale buyer, that distinction is worth thousands of dollars regardless of whether the odometer reads 4 miles or 400.
Why Certain Models Are Financial Anchors
The segment you choose dictates your floor. According to Kelley Blue Book’s 2026 Best Resale Value Awards, luxury sedans from brands like BMW or Mercedes-Benz typically see some of the steepest declines, often losing 50% or more of their value within the first 36 months. Conversely, body-on-frame trucks and certain Japanese hybrids hold onto their value like a lifeline.
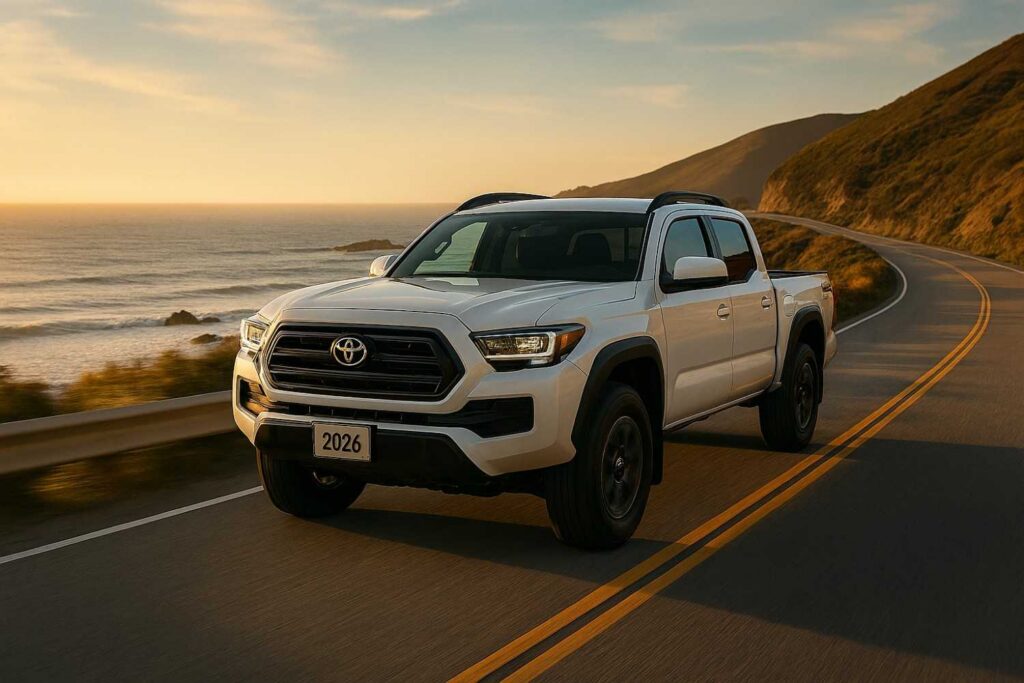
Here is what that actually means for your wallet: if you buy a $60,000 luxury EV, you might be looking at a residual value of just $28,000 in three years. If you put that same $60,000 into a high-demand midsize truck like a Toyota Tacoma, your three-year valuation might still hover around $48,000.
Do you care more about the badge on the grille or the $20,000 difference in your bank account?
| Vehicle Segment | 3-Year Value Retention (Avg) | 5-Year Value Retention (Avg) | Estimated $ Loss on $50k MSRP (5-Yr) |
|---|---|---|---|
| Midsize Trucks | 82% | 68% | $16,000 |
| Compact SUVs | 74% | 58% | $21,000 |
| Luxury Electric Sedans | 45% | 28% | $36,000 |
| Full-Size Vans | 70% | 55% | $22,500 |
Source: Kelley Blue Book 2026 Best Resale Value Awards and Edmunds True Cost to Own 2026 data
The table above illustrates the “segment tax.” When you buy into a high-depreciation segment like luxury EVs, you aren’t just paying for the car; you are paying a massive premium for the privilege of being the first owner during the steepest part of the curve. The truck buyer, meanwhile, is essentially “renting” their vehicle for a fraction of the cost because the secondary market remains starved for their specific model.
The “Sweet Spot” Strategy: Buying at Year Three
The most effective way to beat the system is to let someone else pay for the initial cliff. By the time a vehicle is three years old, it has usually survived its most violent value drop. According to the Federal Reserve’s 2026 consumer credit reports, the average used car loan is now significantly higher than new car rates, though the lower principal often offsets the interest gap.
- Identify models with high initial depreciation (like off-lease luxury cars).
- Check the vehicle’s history via CARFAX to ensure the “deal” isn’t due to an accident.
- Target vehicles that are roughly 36 months old with under 36,000 miles.
This approach allows you to step into a vehicle that still has modern safety tech and perhaps some remaining factory warranty, but at a price point that is 35% to 40% below its original sticker. You are essentially buying the “boring” part of the depreciation curve where the line flattens out.
Why Your Trade-In Is the Dealer’s Best Profit Center
When you walk into a dealership to trade in your current car, the “Actual Cash Value” (ACV) the dealer offers is almost always lower than the KBB Trade-In value. They have to “recondition” the car, which they will claim costs $2,500, even if it just needs a car wash and an oil change.
The gap between what a dealer pays you and what they sell it for is where your equity often erodes significantly. If your car is worth $20,000 on the open market and the dealer offers you $16,000, you just paid a $4,000 convenience fee. In our assessment, selling private-party or using a dedicated buying service is almost always worth the extra three hours of paperwork.
The Interest Trap: Negative Equity and the 84-Month Loan
Long-term loans are the natural enemy of depreciation. If you take out an 84-month loan on a vehicle that loses 25% of its value in year one, you may be “underwater” (owing more than the car is worth) for at least four or five years. This is a dangerous financial position.
If you are involved in a total-loss accident in year two, your insurance company will only pay the “fair market value” — which might be $8,000 less than what you owe the bank. Unless you have GAP insurance, you will likely have to pay that difference out of your pocket. The math works like this: the longer the loan, the slower you build equity, and the more likely depreciation will outrun your payments.
To be fair, some buyers justify this by keeping cars for 10+ years. If you drive a car until the wheels fall off, the “resale value” is irrelevant because you aren’t selling it. However, according to Edmunds data, most Americans trade in every 5.5 years, which means they are constantly resetting the depreciation clock right when it starts to level off.
Identifying the Value Kings of 2026
If you must buy new, you need to look at brands that historically dominate the resale market. According to Kelley Blue Book’s 2026 Best Resale Value Awards, brands like Toyota, Honda, and Subaru continue to lead. These vehicles don’t just “feel” reliable; the market treats them like hard currency. Based on our review of market data, brands like Toyota and Honda have earned this premium through decades of consistent reliability.
- Toyota 4Runner: Historically retains over 65% of its value after five years.
- Porsche 911: According to Kelley Blue Book, this rare luxury outlier often retains 70%+ of its value due to limited supply and high demand.
- Honda Civic: Remains the gold standard for compact car retention at roughly 55-60%.
Buying a car that “holds its value” is the closest thing to a free lunch in the automotive world. You might pay $2,000 more upfront for the Honda over a comparable competitor, but you will likely get $5,000 more back when it is time to sell. That is a net gain of $3,000 just for choosing a different brand name.
Conclusion: Making the $10,000 Decision
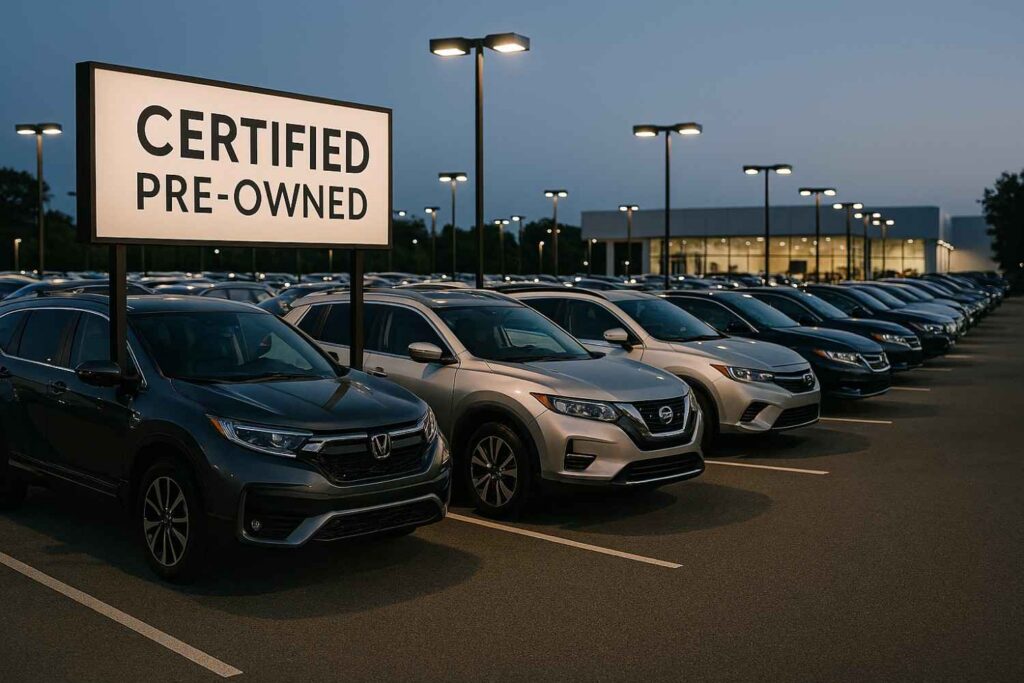
If your goal is to minimize the total cost of ownership, the smarter move is almost always to buy a three-year-old vehicle from a high-retention brand like Toyota or Subaru. The five-year cost difference between a new luxury sedan and a three-year-old CPO (Certified Pre-Owned) midsize SUV can easily exceed $15,000 when you factor in the avoided depreciation hit and lower insurance premiums. In our analysis of 2025–2026 resale data, the three-year-old CPO strategy consistently delivers the best risk-adjusted financial outcome for most buyers.
One limitation of this data is that it cannot predict “black swan” events in the used car market, such as the supply chain disruptions seen in the early 2020s that temporarily inverted the depreciation curve. While we don’t expect that to happen again, the market is always subject to shifts in consumer preference, particularly as EV infrastructure matures.
Your next step should be to run the numbers for your specific target model on the Edmunds True Cost to Own calculator. Do not just look at the monthly payment; look at the “Depreciation” line item over five years. If that number is bigger than your down payment, you might want to rethink the purchase before you sign the dotted line.
References
- Edmunds True Cost to Own
- Kelley Blue Book
- Federal Reserve Consumer Credit
- Consumer Reports Cars
- CFPB Auto Loans
Disclaimer
The information provided in this article is for educational and informational purposes only. It does not constitute professional advice. Readers should conduct their own research and consult with qualified professionals before making any decisions.