
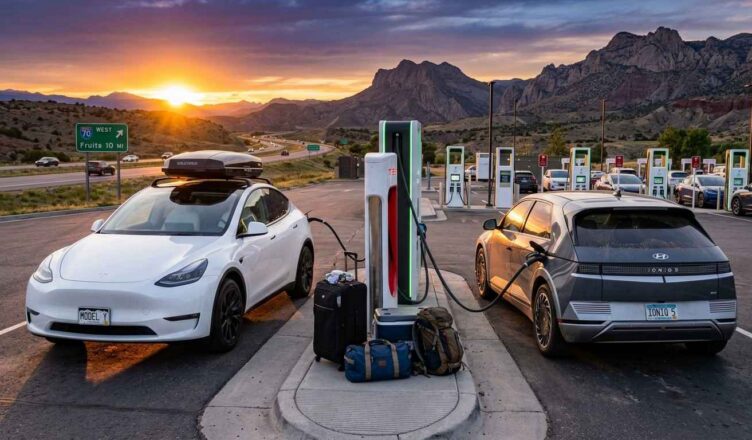
The fastest way to ruin an EV road trip is to plan it like a gas car. The second fastest is to trust the dashboard range number without context. While a 2025 Tesla Model Y Long Range is rated at an EPA-estimated 310 miles, sustained highway speeds of 75 mph typically reduce that real-world range to between 240 and 260 miles depending on factors like elevation and weather. This 15–25% “highway gap” is where most planning mistakes happen.
This guide breaks down how to plan a long-distance EV trip using real charging data and infrastructure realities, rather than marketing numbers.
Real-World Highway Range vs. EPA Ratings
The Environmental Protection Agency (EPA) measures range under controlled conditions that don’t always mirror high-speed interstate travel. Aerodynamic drag increases sharply as speed rises, meaning peak efficiency for most EVs occurs between 45 and 55 mph.
For 2025–2026 planning, use these adjusted highway range benchmarks instead of the sticker number:
| Vehicle (2025/2026 Models) | EPA Range (Miles) | Real Highway Range (75 mph) |
| Chevy Silverado EV RST | 460–492 | ~400+ |
| Tesla Model Y Long Range | 310 | 240–260 |
| Hyundai Ioniq 5 RWD | 303 | 230–250 |
| Ford Mustang Mach-E AWD | 270 | 210–230 |
| Chevrolet Equinox EV | 319 | 250–270 |
When planning, a safe rule of thumb is to take your expected highway range and subtract a 10–15% buffer to account for unexpected detours or headwinds.
The Charging Curve: Why 10% to 80% is the Goal
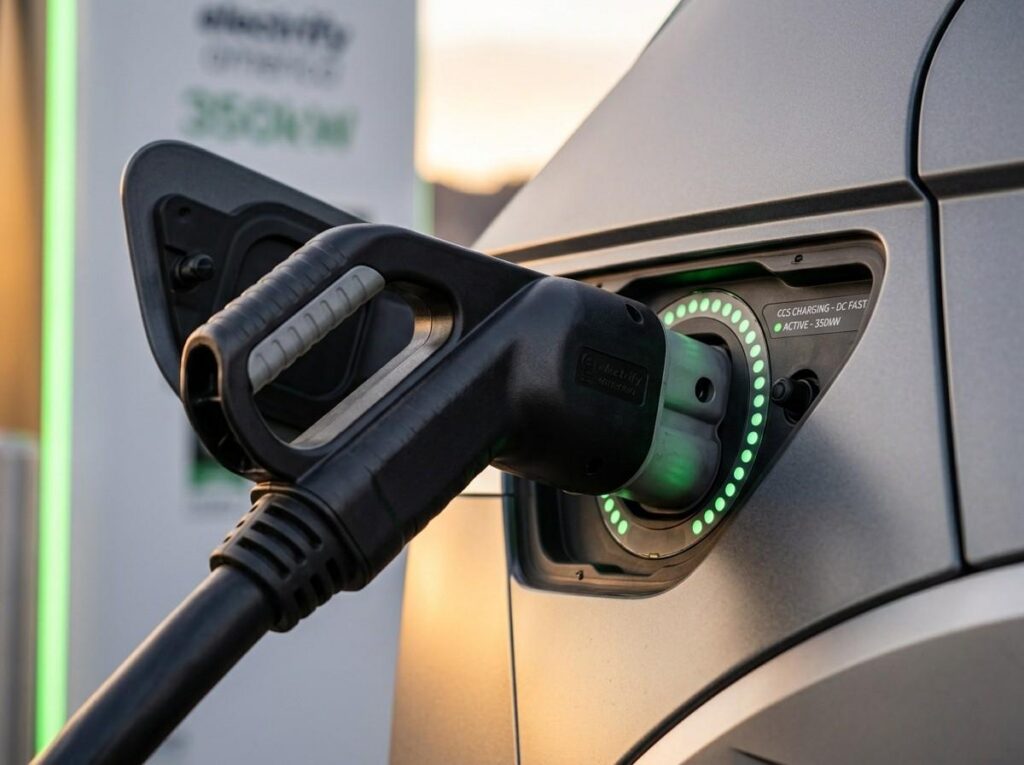
A 350 kW charger does not guarantee your car will charge at that speed for the entire session. Most EVs follow a “charging curve” where speed peaks when the battery is low and tapers significantly as it reaches 80%.
Strategic road tripping involves charging more often for shorter periods—typically 20 to 40 minutes per stop—rather than waiting to hit 100%. This is because the last 20% of a charge can often take as long as the first 50%.
Comparison of Real-World Charging Performance:
- Hyundai Ioniq 5 (800V Architecture): Can add roughly 180 miles in 15 minutes, with a 10–80% charge time of approximately 18 minutes.
- Tesla Model Y: Adds about 160 miles in 15 minutes, taking roughly 27 minutes for a 10–80% session.
- Ford Mustang Mach-E: Adds approximately 120 miles in 15 minutes, requiring about 36 minutes for a 10–80% charge.
Infrastructure Reality and Regional Availability
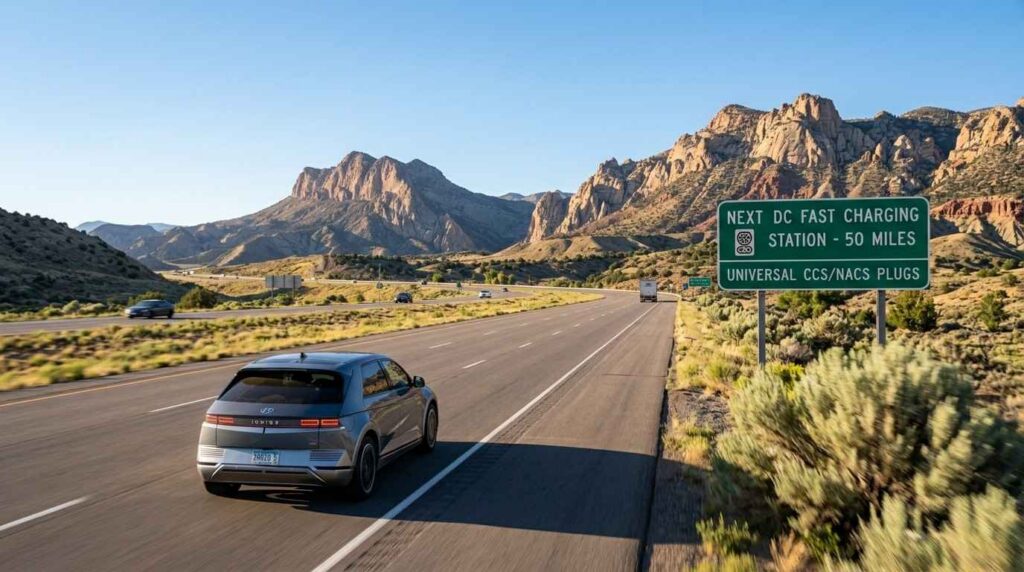
As of early 2026, the U.S. has surpassed 326,000 public charging ports across more than 77,000 locations. While the network grew by approximately 30% in 2025 alone, distribution remains uneven.
High-utilization states like California (23.6%), New Jersey (21.6%), and Florida (20.2%) offer excellent reliability. Conversely, rural states such as North Dakota (2.6%) and Montana (1.9%) have much lower station density, requiring more rigorous pre-trip planning. You should use the DOE Charging Station Locator to verify corridor coverage before departing.
Essential Route Planning Tools
Modern EV road planning requires tools that account for live data like elevation, temperature, and charger reliability.
- A Better Routeplanner (ABRP): Widely considered the gold standard for vehicle-specific energy modeling. It factors in your specific EV model, passenger load, and even headwinds to predict arrival state-of-charge.
- PlugShare: Essential for “sanity-checking” stops. Drivers should check recent user reviews for any planned DC fast charger to ensure stalls are functional and not congested.
- Google & Apple Maps: Increasingly integrated with live vehicle data for real-time traffic and automatic rerouting to chargers.
The Real Cost of Fast Charging
Public DC fast charging is significantly more expensive than home charging. As of Q3 2025, the national average for public fast charging rose to $0.49 per kWh. In expensive markets like Hawaii, prices can reach as high as $0.85 per kWh, while more affordable states like Nebraska average around $0.42 per kWh.
Estimated Cost per 100 Miles:
- Home Charging ($0.12–$0.18/kWh): $4 – $6
- Public DC Fast Charging ($0.49/kWh average): ~$15
While still often cheaper than gasoline, these costs can approach fuel parity in high-priced regions.
Conclusion
What the Data Confirms:
EV road trips are increasingly predictable. Modern EVs can comfortably cover 200–260 miles between highway stops, and the growth of high-power (250 kW+) stations is reducing congestion and wait times. Success relies on a “low-and-fast” strategy: arriving at chargers with a low state of charge (10–20%) and leaving once you hit 80%.
What Remains Variable:
Regional gaps in rural areas and fluctuating public charging costs require vigilance. Always verify your vehicle’s specific efficiency on fueleconomy.gov and use live-data tools like ABRP to adjust for real-time conditions.
References
- Fuel Economy and EV Range Testing | US EPA
- DOE Alternative Fuels Data Center: EV Infrastructure
- Joint Office of Energy and Transportation: Infrastructure Growth
- National Renewable Energy Laboratory (NREL)
- Edmunds True Cost to Own (TCO) Calculator
Disclaimer
The information provided in this article is for educational and informational purposes only. It does not constitute professional advice. Readers should conduct their own research and consult with qualified professionals before making any decisions.