
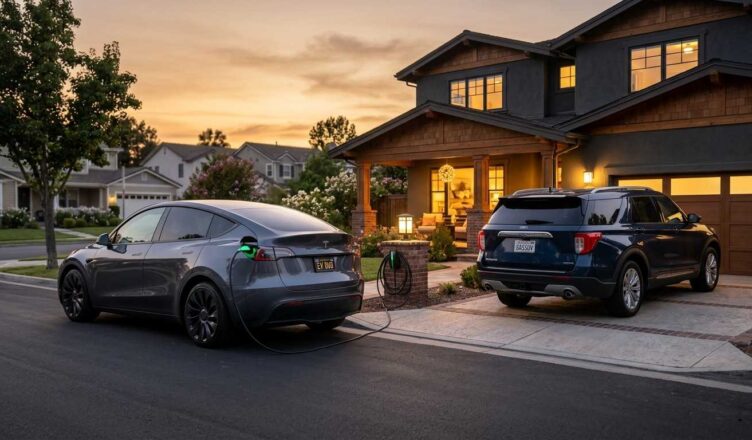
A typical U.S. driver covering 12,000 miles a year in 2026 will spend roughly $600–$900 on electricity for an EV, while a comparable gasoline SUV will cost between $1,500 and $1,800 to fuel. This gap has remained remarkably consistent even as both energy sectors have faced inflationary pressure. While the upfront price of vehicles often dominates the conversation, the operational “fuel” cost is where the long-term financial shift occurs.
You are likely here for the math rather than the marketing. This breakdown utilizes 2026 EPA efficiency data, Department of Energy (DOE) charging cost averages, and current AAA fuel pricing to demonstrate what you actually pay per mile. We will examine how home charging compares to public fast charging and where the savings hold—or where they begin to diminish.
What You Pay Per Mile: The Core Comparison
Most consumers still conceptualize vehicle costs in “full tank” terms, but per-mile cost is the more accurate metric for 2026. According to the 2026 DOE Alternative Fuels Data Center report, the average EV consumes approximately 28–32 kWh per 100 miles. With U.S. residential electricity averaging 17.45 cents per kWh as of early 2026, the costs break down as follows:
- EV cost per mile (Home): ~$0.049
- Gas vehicle cost per mile (30 mpg at $3.98/gal): ~$0.133
The gasoline cost is roughly 2.7 times higher. This disparity exists because home charging is essentially a “wholesale” purchase of energy, whereas gasoline is a retail product with significant taxes, refining, and distribution costs baked into every gallon. However, this math is highly dependent on where and how you charge.
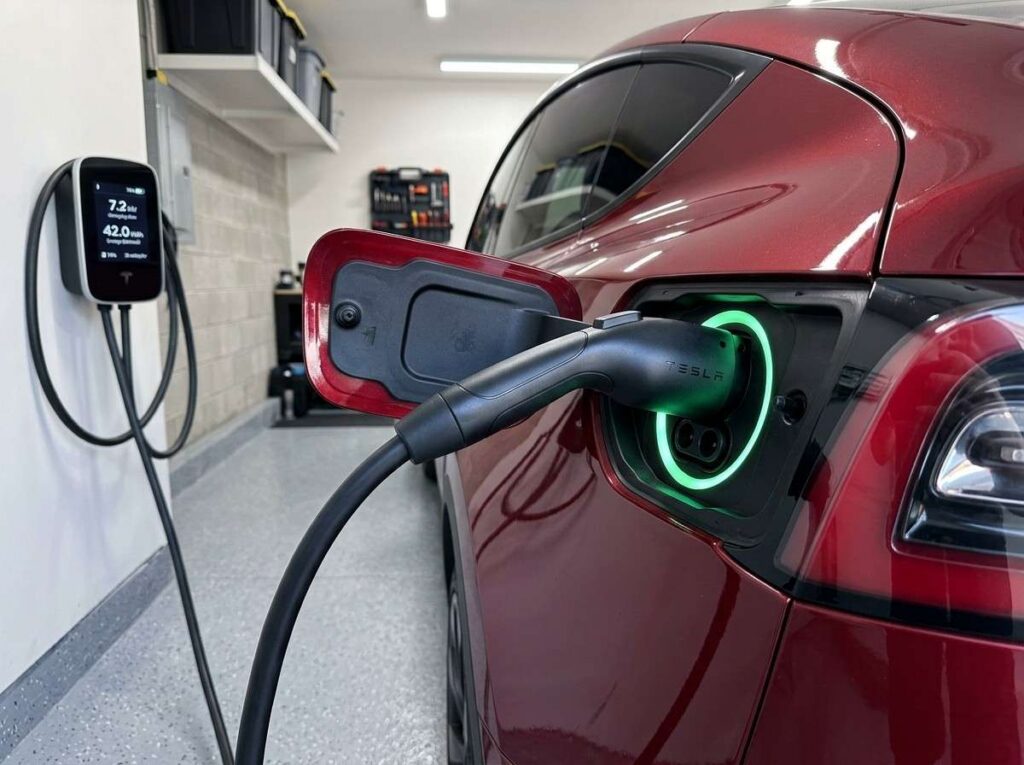
Home Charging vs. Public Fast Charging: The Real Split
If you charge primarily at home, the savings are predictable. If you rely on public fast chargers, the financial equation shifts. According to the 2026 DOE EV Resources report, approximately 80% of EV charging continues to occur at home.
The following table illustrates how costs scale across different charging tiers in 2026:
| Charging Type | Avg. Cost per kWh | Cost per Mile (Typical EV) |
| Home (Level 2) | $0.17 | $0.05 |
| Public Level 2 | $0.28 | $0.08 |
| DC Fast Charging | $0.55 | $0.16 |
| Gasoline (30 mpg) | — | $0.13 |
Data reflects 2026 EIA residential averages and 2026 AAA national gas averages. In our assessment, relying on DC fast charging more than 50% of the time can actually make an EV more expensive to fuel than a highly efficient hybrid gasoline vehicle. Fast charging is a premium service for travel convenience, not a cost-saving tool for daily use.
Real Vehicle Comparison: Tesla Model Y vs. Toyota RAV4 Hybrid
To ground these numbers in reality, let’s compare two of the most popular vehicles in the 2026 market: the Tesla Model Y Long Range and the Toyota RAV4 Hybrid. Both are similar in size and utility.
| Feature | 2026 Tesla Model Y LR | 2026 Toyota RAV4 Hybrid |
| Efficiency | 28 kWh / 100 mi | 43 MPG (Combined) |
| Energy Unit Cost | $0.17 / kWh | $3.98 / gallon |
| Cost Per Mile | $0.048 | $0.093 |
| Annual Fuel Cost | $571 | $1,116 |
Source: 2026 EPA Fuel Economy Data. This calculation assumes 12,000 annual miles and 100% home charging for the EV. The Tesla saves approximately $545 per year in energy costs alone compared to one of the most efficient gasoline-powered SUVs on the road. If the RAV4 were a non-hybrid model, the savings would double.
Maintenance: The Hidden Savings Layer
Fuel is only half of the operational cost. According to the 2026 Consumer Reports automotive study, EV owners spend approximately 35% less on scheduled maintenance over the first five years of ownership compared to gas car owners. This is primarily due to the elimination of oil changes, transmission fluid flushes, and spark plug replacements.
While EVs do require tires more frequently due to their weight and instant torque, the lack of an internal combustion engine’s complex cooling and exhaust systems significantly reduces the likelihood of “surprise” repair bills as the vehicle ages. Furthermore, regenerative braking preserves the mechanical brake pads, often extending their life to over 100,000 miles.
The Impact of 2026 Incentives and Tax Planning
The federal IRS Clean Vehicle Credit remains a critical factor in 2026. For eligible buyers, a $7,500 credit is available for new qualifying EVs, provided the MSRP for an SUV is $80,000 or less. In our assessment, the most significant change this year is the “stacking” of benefits.
Under the 2026 tax code updates, owners can often claim a 30% tax credit (up to $1,000) for the installation of a home Level 2 charger. Some states, such as Connecticut and Colorado, offer additional rebates that can push the total purchase incentive over $10,000. When combined with $500–$1,000 in annual fuel savings, the “payback period” for the EV price premium has shrunk to roughly three years for many households.
Where the EV Advantage Weakens
Despite the strong national averages, an EV is not always the cheaper choice. There are three specific scenarios in 2026 where the math leans toward gasoline or hybrids:
- High Electricity Regions: In states like Hawaii or Massachusetts, where residential rates exceed $0.30 per kWh, the cost per mile for an EV climbs to $0.09—nearly identical to a 43 MPG hybrid.
- No Home Charging: Apartment dwellers who must rely on public chargers pay “retail” rates that can match or exceed gasoline costs.
- Extreme Cold: 2026 DOE testing shows that range can drop by 20% in sub-zero temperatures, which effectively raises your cost per mile during winter months.
In our assessment, the convenience gap for those without home charging is often a larger deterrent than the cost itself. If you cannot “refuel” while you sleep, you are trading time for savings, which changes the value proposition.
Conclusion: Who Actually Saves Money in 2026?
For the majority of U.S. drivers, especially those with a garage or driveway, the 2026 financial data is clear: an EV is significantly cheaper to operate than a gasoline counterpart. The energy cost savings of $500–$1,000 annually, paired with lower maintenance and substantial tax credits, outweigh the higher initial purchase price for most long-term owners.
However, your specific ZIP code and housing situation are the ultimate deciders. You should plug your local electricity rates and common driving routes into the 2026 DOE Alternative Fuels Data Center calculator and compare your shortlisted models using the Edmunds True Cost to Own tool. These resources will provide a localized financial map that national averages simply cannot replace.
References
- 2026 EPA Fuel Economy Guide and Database
- DOE Alternative Fuels Data Center: 2026 Cost Calculator
- IRS New and Used Clean Vehicle Tax Credit Rules (2026)
- AAA National Gas Price Index – March 2026
- EIA Residential Electricity Price Update – January 2026
- Edmunds 2026 True Cost to Own (TCO) Analysis
Disclaimer
The information provided in this article is for educational and informational purposes only and does not constitute professional financial or automotive advice. Energy prices and tax incentives vary by region and individual eligibility; readers should consult with a qualified professional before making purchase decisions.